|
|
|
July performance: Our Global Markets Snapshot breaks down a month of returns across dozens of indexes and sectors. Read it here.
Tech VC trends: You can access previews of our new client-only reports on agtech, clean energy, enterprise fintech and supply chain.
Q2 comp sheets: Our quarterly guides on public company valuations and financials are now available for fintech and healthtech. |
|
|
|
|
|
| |
| A message from Fidelity Private Shares LLC |
|
|
| Top Venture Capital Trends Startups Should Watch in 2025 |
|
Startup executives, venture capital is always changing—staying current is critical.
Fidelity’s guide, "Top Venture Capital Trends Startups Should Watch in 2025," delivers the latest insights on:
- AI-Driven Growth: How companies like OpenAI and Waymo are securing major funding.
- Regional Insights: Key strengths of top venture hubs.
- Sustainable Growth: Why smart management and sound models drive better exits.
- Market Recovery: Rebound in venture deals and extended fundraising timelines.
- Exit Strategies: M&A trends and their strategic advantages.
Download the guide to navigate midstage VC with confidence and position your company for long-term success.
Fidelity Private Shares LLC offers cap table management and other administrative services to private companies and their equity plans. |
|
|
|
|
|
| |
| A new look at private market manager rankings |
|
This week we released the latest edition of our Global Manager Performance Score League Tables, now expanded to nearly 30 strategy and regional categories, with the comprehensive lists available in our News & Analysis website.
This year's release offers the broadest view yet of how fund families across private equity, venture capital, credit, real assets, and secondaries have performed, based on a rigorous, data-driven framework.
At the heart of the rankings is the PitchBook Manager Performance Score, a standardized, vintage-agnostic metric designed to help investors evaluate a GP's performance across an entire fund family.
Unlike traditional quartile rankings, which often oversimplify complex track records, our scoring method considers the dispersion of performance relative to its benchmark. It also incorporates factors like maturity and DPI, which help determine the degree to which interim returns are realized.
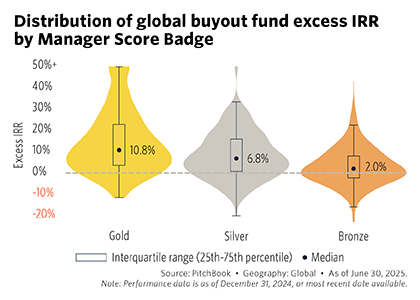
This year, we have introduced gold, silver, and bronze tiers to improve interpretability. Fund families in the top 10th percentile of scores within a category receive gold, those in the 75th to 90th percentile receive silver, and those with scores above 50 receive bronze.
These distinctions reflect consistency and excess performance across time and strategy. For example, gold-rated buyout managers showed a median excess IRR of 10.8% relative to their benchmarks, while bronze managers' median fund excess IRR was only 2.0%. |
|
The 2024 edition features 13 global strategy categories in the standalone Global Manager Performance Score League Tables report, with additional regional breakouts and expanded fund family rankings available on our News & Analysis webpage.
In total, the dataset includes over 2,000 fund families from more than 1,400 GPs, using performance data through year-end 2024.
Importantly, these scores are not endorsements, nor are they intended to predict future results. As always, past performance is not a guarantee of future returns. However, we believe the Manager Performance Score offers a useful and consistent lens for comparing fund families. It is meant to augment a deeper diligence process, not replace it.
As private markets become more competitive and performance histories more complex, having structured, data-driven tools can help bring greater transparency to manager selection and performance analysis.
Explore the full rankings now and let us know what you think.
Have a great weekend,
Zane Carmean, CFA, CAIA
Director, Quantitative Research
Susan Hu
Quantitative Research Analyst |
|
|
|
|
|
| |
|
|
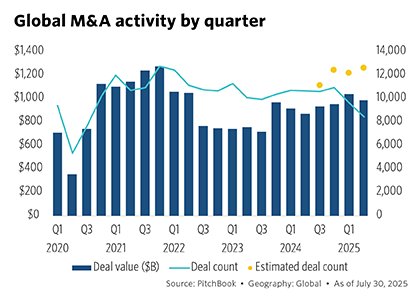
Global M&A Report
M&A activity worldwide is on pace for a record year in deal count.
Despite ongoing market uncertainty, the broader M&A landscape remained robust in Q2, marking the third consecutive quarter of deal value around $1 trillion across about 12,000 transactions. |
|
The strength in the M&A market reflects the growing number of firms scaling up through acquisitions to navigate new risks and opportunities emerging this year.
The second quarter was characterized by strategic cross-border consolidation, rebalanced sector exposure, and greater alignment on valuations between buyers and sellers.
The first two quarters have set 2025 up to be yet another year of strong M&A activity.
Read the free report
|
|
|
|
|
|
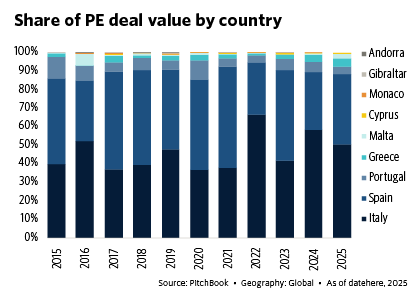
Southern Europe Private Capital Breakdown
Our all-new report covers trends in Southern Europe's private markets.
The region showed resilience in H1 2025, with VC activity outpacing 2024 levels and PE remaining active despite macroeconomic headwinds. |
|
VC dealmaking was led by late-stage rounds in Spain and Portugal and a surge in AI investment. The exit market remains under pressure with muted IPO markets.
In PE, we note a surge in dealmaking in Italy. CVC Capital Partners was one of the busiest PE firms in terms of exit value in Southern Europe.
Fundraising continues to slow across the region.
Read the free report
|
|
|
|
|
|
| |
|
|
Novel Ingredients
The novel food ingredients sector is experiencing a dramatic reset.
After VC funding peaked at over $5 billion in 2021, it dropped to $1.5 billion in 2024. But investor interest persists, especially in early-stage deals and high-growth segments like precision fermentation, novel fats and oils, and functional health-impact ingredients. |
| | | | | | |